 MathCS.org - Statistics
4.3 How to select Random Samples
We have previously introduced the mean and the median. Now we want to see how to use Excel to compute these values for (reasonably) large data sets, as well as learn how to predict the population mean using a sample mean and/or median. First, we need a data set that we can analyze.
Click on the above Excel link to download an Excel spreadsheet that contains data about the salary levels of graduates from the University of Florida in the early 90's. The Excel spreadsheet should look similar to this (only the first few rows are displayed in the picture below):
First, let's find the average as well as the median of the salary level for all graduates in the survey.
- Go to the end of column C
- Enter =average(, then use the mouse to select all cells in column C that contain numbers
- Type ) to close the parenthesis, then hit RETURN
- Move one cell below the average
- Enter the formula =median(, then use the mouse to select all cells in column C that contain numbers except, of course, the cell containing the current average that was previously computed.
- Type ) to close the parenthesis, then hit RETURN
- Add some labels in front of the numbers just computed
Here are the answers (and the formulas used to compute them):
In other words, according to our data we would say that the average salary of all graduates from the University of Florida earned approximately $26,000.
Note that the mean and the median are very close together, which is usual for a "balanced" distribution (we'll define that a little later). From the information we have about the data set, we actually do not know if the data really contains all graduates or just a representative sample.
- If the data did include all graduates, $26,064 is the population mean, and there is no statistical error involved.
- If the data did not include all graduates, but a representative sample instead, then $26,064 would be the sample mean, and we would use that as an estimate for the (unknown) population mean. In this case, we really should also provide a margin of error for our estimate - we will do that in a later module.
While Excel can compute the mean and median very quickly for this data set, it would be tedious to do so "by hand". To simplify the computation and to illustrate the difference between population mean and sample mean, we will assume that the Excel data set is the entire information for all recent graduates of the University of Florida and do the following:
- Select 10 salaries at random from that data set. These numbers form a sample of size 10.
- Compute the mean and median of this sample (which is easy to do, even with a calculator)
- Compare this sample mean and median to the actual population mean
Selecting a Random Sample from a Population
The problem in the above example is how to select the 10 numbers "at random". To remove any bias (which we would introduce if we attempt to pick randomly "by hand", say), we will use Excel's random sample selection tool:
- In Excel, click on "Data" and select "Data Analysis ..."
- Scroll down and select "Sampling", then click on "OK". You should see a dialog window similar to this:
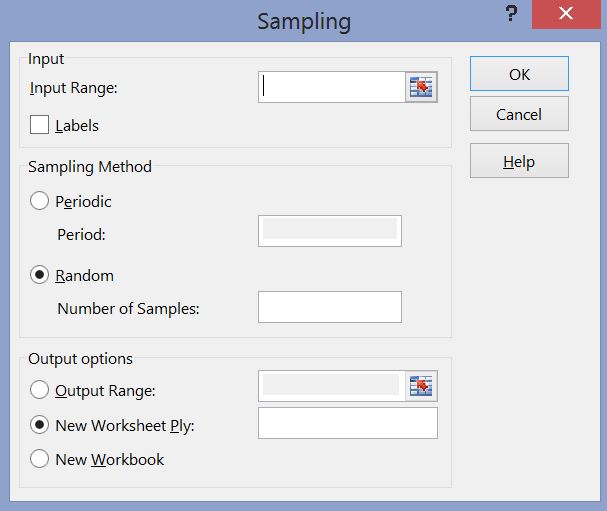
Use the "cell selector" icons
![]() to
select all cells containing salaries, and enter the sample
size of 10 in the "Number of Samples:" input field.
to
select all cells containing salaries, and enter the sample
size of 10 in the "Number of Samples:" input field.
Note that in this dialog box the sample of size 10 will go into a new worksheet. Click OK and a sample of size 10 is selected at random. In our case, the sample data is as follows (note that since the sample is selected at random, your numbers will differ from the ones below):
- Now let's use the standard =average(RANGE) and =median(RANGE) functions for this sample set to compute the sample mean and median, as in the following picture:
In other words, the sample mean we computed using 10 salaries is $23,700, and the sample median is $25,750 (again, your numbers will be different since your random sample should be different). Either number is a reasonable estimate for the actual population mean which was about $26,000.
To complete a valid statistical analysis, we should also provide a maximal error for our estimation, but we will cover that in a later module.
Discussion Topic: If you repeated the above exercise once for really small sample sizes, and again for larger sample sizes, which would give better estimates?
Note that computing the sample mean for only 10 numbers is very easy and the result is pretty close to the actual population mean of over 1,100 salaries. We have therefore achieved a compromise: we use less effort for our computation of the mean, but our answer will be somewhat less accurate. Alternatively, we could expend a lot of effort in the computation of the mean (using the entire population) and as a benefit our result will be totally accurate.