5.2 Percentage Tables
So far we have analyzed data one variable at a time. We have seen how to compute mean, mode, median, and variance, but each formula only applied to one variable at a time. Now we want to investigate two (or more) variables simultaneously. Usually, a typical question about two variables is:
Is there some relation between one variable and another one, and if so, how can one use knowledge about one variable to predict, approximately, the other.
Answers to such questions can be very useful:
- if smoking causes cancer, we should stop smoking
- if having an advanced college degree increases the chance to have a well-paying job, we should try our best to graduate college
- if exercising and working out increases our general state of health, we should exercise and work out regularly
- if a new drug really does have a positive impact on lowering blood pressure, we should take it if we have high blood pressure
In most cases the "if" part is the difficult one to determine, i.e. it is not so easy to find out whether two variables (for example smoking and cancer) are indeed related, and even if they are related, it is even harder to determine which is cause and which is result (if smokers have higher cancer rates, does smoking cause cancer, or does having cancer cause you to smoke). In general, correlation does not necessarily imply causation. Here are two examples of incorrectly infering causation from correlation (see http://en.wikipedia.org/wiki/Correlation_does_not_imply_causation):
- The more firemen fighting a fire, the bigger the fire is observed to be. Therefore firemen cause an increase in the size of a fire.
- Sleeping with one's shoes on is strongly correlated with waking up with a headache. Therefore, sleeping with one's shoes on causes headaches.
But let's start at the beginning. We will start our investigation about relationships between variables by taking a closer look at representing data in tables. We won't worry about correlation or causation for now.
Example: The residents of Green Township were asked what their
opinion about a new Zoning Ordinance was. The answers were broken
down by age of the people who were questioned. The result of the
survey is summarized in the following table:
age
50 or underage
over 50Total For Zoning 92 87 179 Against or no opinion 158 75 233 Total 250 162 412
This table can, of course, be entered into Excel directly, and using a few tools that Excel provides the data entry and formatting is quick and effortless.
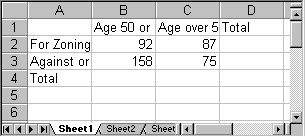
- First, let's enter the "raw" data, i.e. all data that is actually collected as opposed to computed data. Our spreadsheet will look similar to this:
Note that some labels may not be completely visible - we will rectify that later automatically.
- Next,
we will asked Excel to compute the totals for us "on the fly".
Excel provides a very convenient button for that on the "Home"
ribbon: the "Auto Sum" button
 . Position the
cursor in the cell for the first row total and press "Auto Sum"
 .
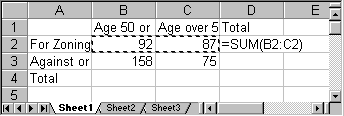
Excel will indicate the cells that it is going to sum up, which
should be all cells to the left (of course you could also enter
the "=sum()" formula and pick the range manually, but the 'auto
sum' tool is quicker in this case).
- Press ENTER to accept the choice and Excel will automatically compute the total and enter it in the appropriate cell.
- Keep on using the "Auto Sum" button until all totals are computed. In other words, each time position the cursor first in the cell that will contain the sum, then press "Auto Sum", then press ENTER.
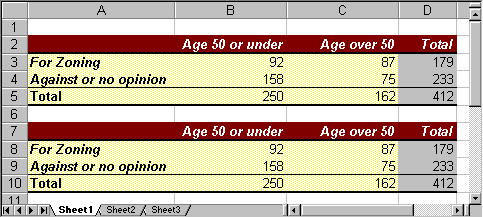
- You can optionally format your table to make it look nice. Select "Format as Table" on the "Home" ribbon and pick a format you like. Here is the final table, nicely formatted (with all labels visible):
If your table does not look like this it is fine, but it should contain the appropriate row and column totals.
Row and Column Percenta
The above table looks nice, but is not very helpful. It is not meaningful, for example, to know that 92 people age 50 or under are for zoning. What would be useful, of course, would be to know percentages instead of actual figures. So, to better analyze the data we will convert each number to percent. However, for each entry there are three possible percentages to compute:- we could use a row total to convert a number into percent (row percentages)
- we could use a column total to convert a number into percent (column percentages)
- we could use the grand total to convert a number into percent (total percentages)
Row and column percentages are the most useful, and we will first show how to generate each of them, then discuss when to use which.
Let's convert each number into the appropriate row percentages, i.e. we will use the row total to convert a number into percent:
First, we will copy the original table to a new location just below it:- select all cells from the table
- choose "Copy" from the "Edit" menu
- position the cursor in the first column a few cells below the original table
- select "Paste" from the "Edit" menu.
A second copy of the original table will appear.
At this point you have a choice:
- you could convert the numbers to percentages "by hand" (well, by hand would mean using a regular calculator)
- you could convert the numbers to percentages using Excel
Excel would do the computations for you, of course, but in this case the power of Excel might actually be overkill. So, we will first convert the figures by hand, using a normal calculator, and then - as an appendix for the Excel enthusiast - we'll show how to use Excel if you insist.
Converting to Row Percentage
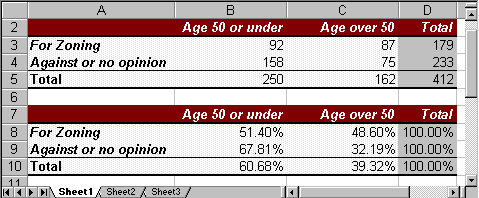
In cell B8 the 'raw data' is 92, indicating that there were 92 people age 50 or under who were 'for' zoning. The total in row 8 is 179, indicating that a total of 179 people were 'for' zoning. Thus, the row percentage of people 'for' zoning who are age 50 or under is
Thus, 0.514 (or 51.4%) of those people 'for' zoning were age 50 or under, and therefore we manually enter the number 0.514 into cell B8, replacing the original value of 92.
Similarly, in cell C8 the raw data is 87, which we convert into row percentage as follows
Thus, 0.486 (or 48.6%) of those people 'for' zoning were over 50 years of age, so we manually enter the number 0.486, replacing the value of 87.
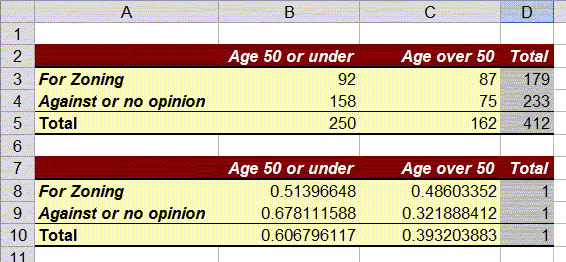
We repeat similar calculations to turn all of the raw data in rows 9 (dividing by 233) and 10 (dividing by 412) into row percentages, and we replace the row totals by 1 (or 100%). Our converted table should look like this, showing the converted numbers but not in percentages:
Finally, it is simple to get Excel to format the numbers in cells B8:D10 as percentages:
- Mark the cells containing the ratios in the second table (B8 to D10)
- Click the "%" symbol on the "Home" ribbon, or choose "Percentage" from the drop down menu in the "Number" group.
Converting to Column Percentage
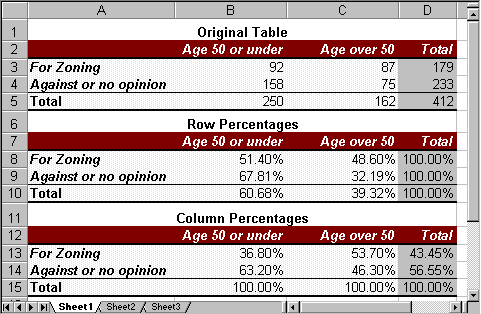
Similarly, we can create a third table, containing column percentages. The details are left as an exercise, but for the calculations we need to convert the raw data values by dividing by the column totals instead of the row totals. If we do everything correctly our three tables (properly formatted) should look like this:
When to use Row Percentages, when Column Percentages
Now that we know how to create either row or column percentages, let's try to determine when to use which. For that, consider two similar but very much different questions:
- How many people, in percent, who are for the zoning law are age 50 or under?
- How many people, in percent, 50 or under are for the zoning law?
These questions seem similar: we are looking at the intersection between the row "For Zoning" and the column "Age 50 or under". From the first table we know that 92 people fall into that category, but that number is not in percent. On the other hand, there are two candidates for the percentage number, 52.4% from the row percentages or 36.8% from the column percentages. Which one answers which question ?
- Question 1 asks, rephrased: out of all people who are for the zoning law, how many of them are age 50 or under. In other words, question 1 considers all people who are for the zoning law as a total - that is a row total, so that the answer to question 1 is the row percentage 51.4%.
- Question 2 asks, rephrased: out of all people who are 50 or under, how many of them are for the zoning law. In other words, question 2 considers all people who are 50 or under as a total - that is a column total, so that the answer to question 2 is the column percentage 36.8%.
From that example we see that the key to answer questions such as these is which group is considered the "total" group for the particular question:
- if the total for that group is found in a row, use row percentages
- if the total for that group is found in a column, use column percentages
It seems that generating these percentage tables is a fair amount of work. Of course Excel provides an easier method for generating such tables from actual data, which we will explore soon.
Appendix: Converting to Percentages using Excel
In this case it is simpler doing the proper computations using a regular calculator, but we could use Excel just as well. I recommmend you check out the video below, or follow the step-by-step instructions after that, but the video contaiins a few fun and helpful Excel tricks - you don't want to miss them.
If you prefer written instructions, try these: our starting point is the original table with the raw data values, copied to a second version as in this picture:
Now position the cursor into cell B8 (second table, containing the value 92). We will replace this "raw" value by a computed one as follows:
The value 92 in the second table will now be replaced by the appropriate ration 0.5139 (which is not in percent, but do not worry about that right now).
- type "=" (the equal sign)
- click once in the first table on the value 92 (cell B3)
- type "/" (the division symbol)
- click once in the first table on the value 179 (cell D3)
- hit ENTER
We repeat this calculation for the next cell, C9 (second table, containing the value 87). We compute row percentages:
- type "=" (the equal sign)
- click once in the first table on the value 87 (cell C3)
- type "/" (the division symbol)
- click once in the first table on the value 179 (cell D3)
- hit ENTER
If we keep going this way, we can convert all numbers into
row percentages. Actually, all numbers so far will be decimal
values, but we can easily format them as percentages as outlined
above.
And it should be possible, now, to convert the raw
data into column percentages, using Excel - see above for the final
tables.
The advantages of this approach is that - while more
work than using a calculator - the percentage table(s) will
automatically update if the raw data values change if we use Excel
formulas.
Practicing
To practice, consider the following table of raw numbers, relating sex (or gender) with puls rate (the numbers are from a survey for this class):| low pulse rate | high pulse rate | Totals | |
| Male | 1 | 1 | 2 |
| Female | 9 | 6 | 15 |
| Totals | 10 | 7 | 17 |
- How many males (in percent) have a high pulse rate?
- This is a row percent so the answer (in percent) is: 1 / 2 * 100 = 50%
- how many people (in percent) with a high pulse rate are female?
- This is a column percent so the answer (in percent) is: 6/7 * 100 = 85.7%
 MathCS.org - Statistics
